Redesigning the Gantt chart that studios had stopped trusting
How a read-only Client View brought studios’ biggest projects back from Google Sheets and into Streamtime’s Timeline.
01 Background
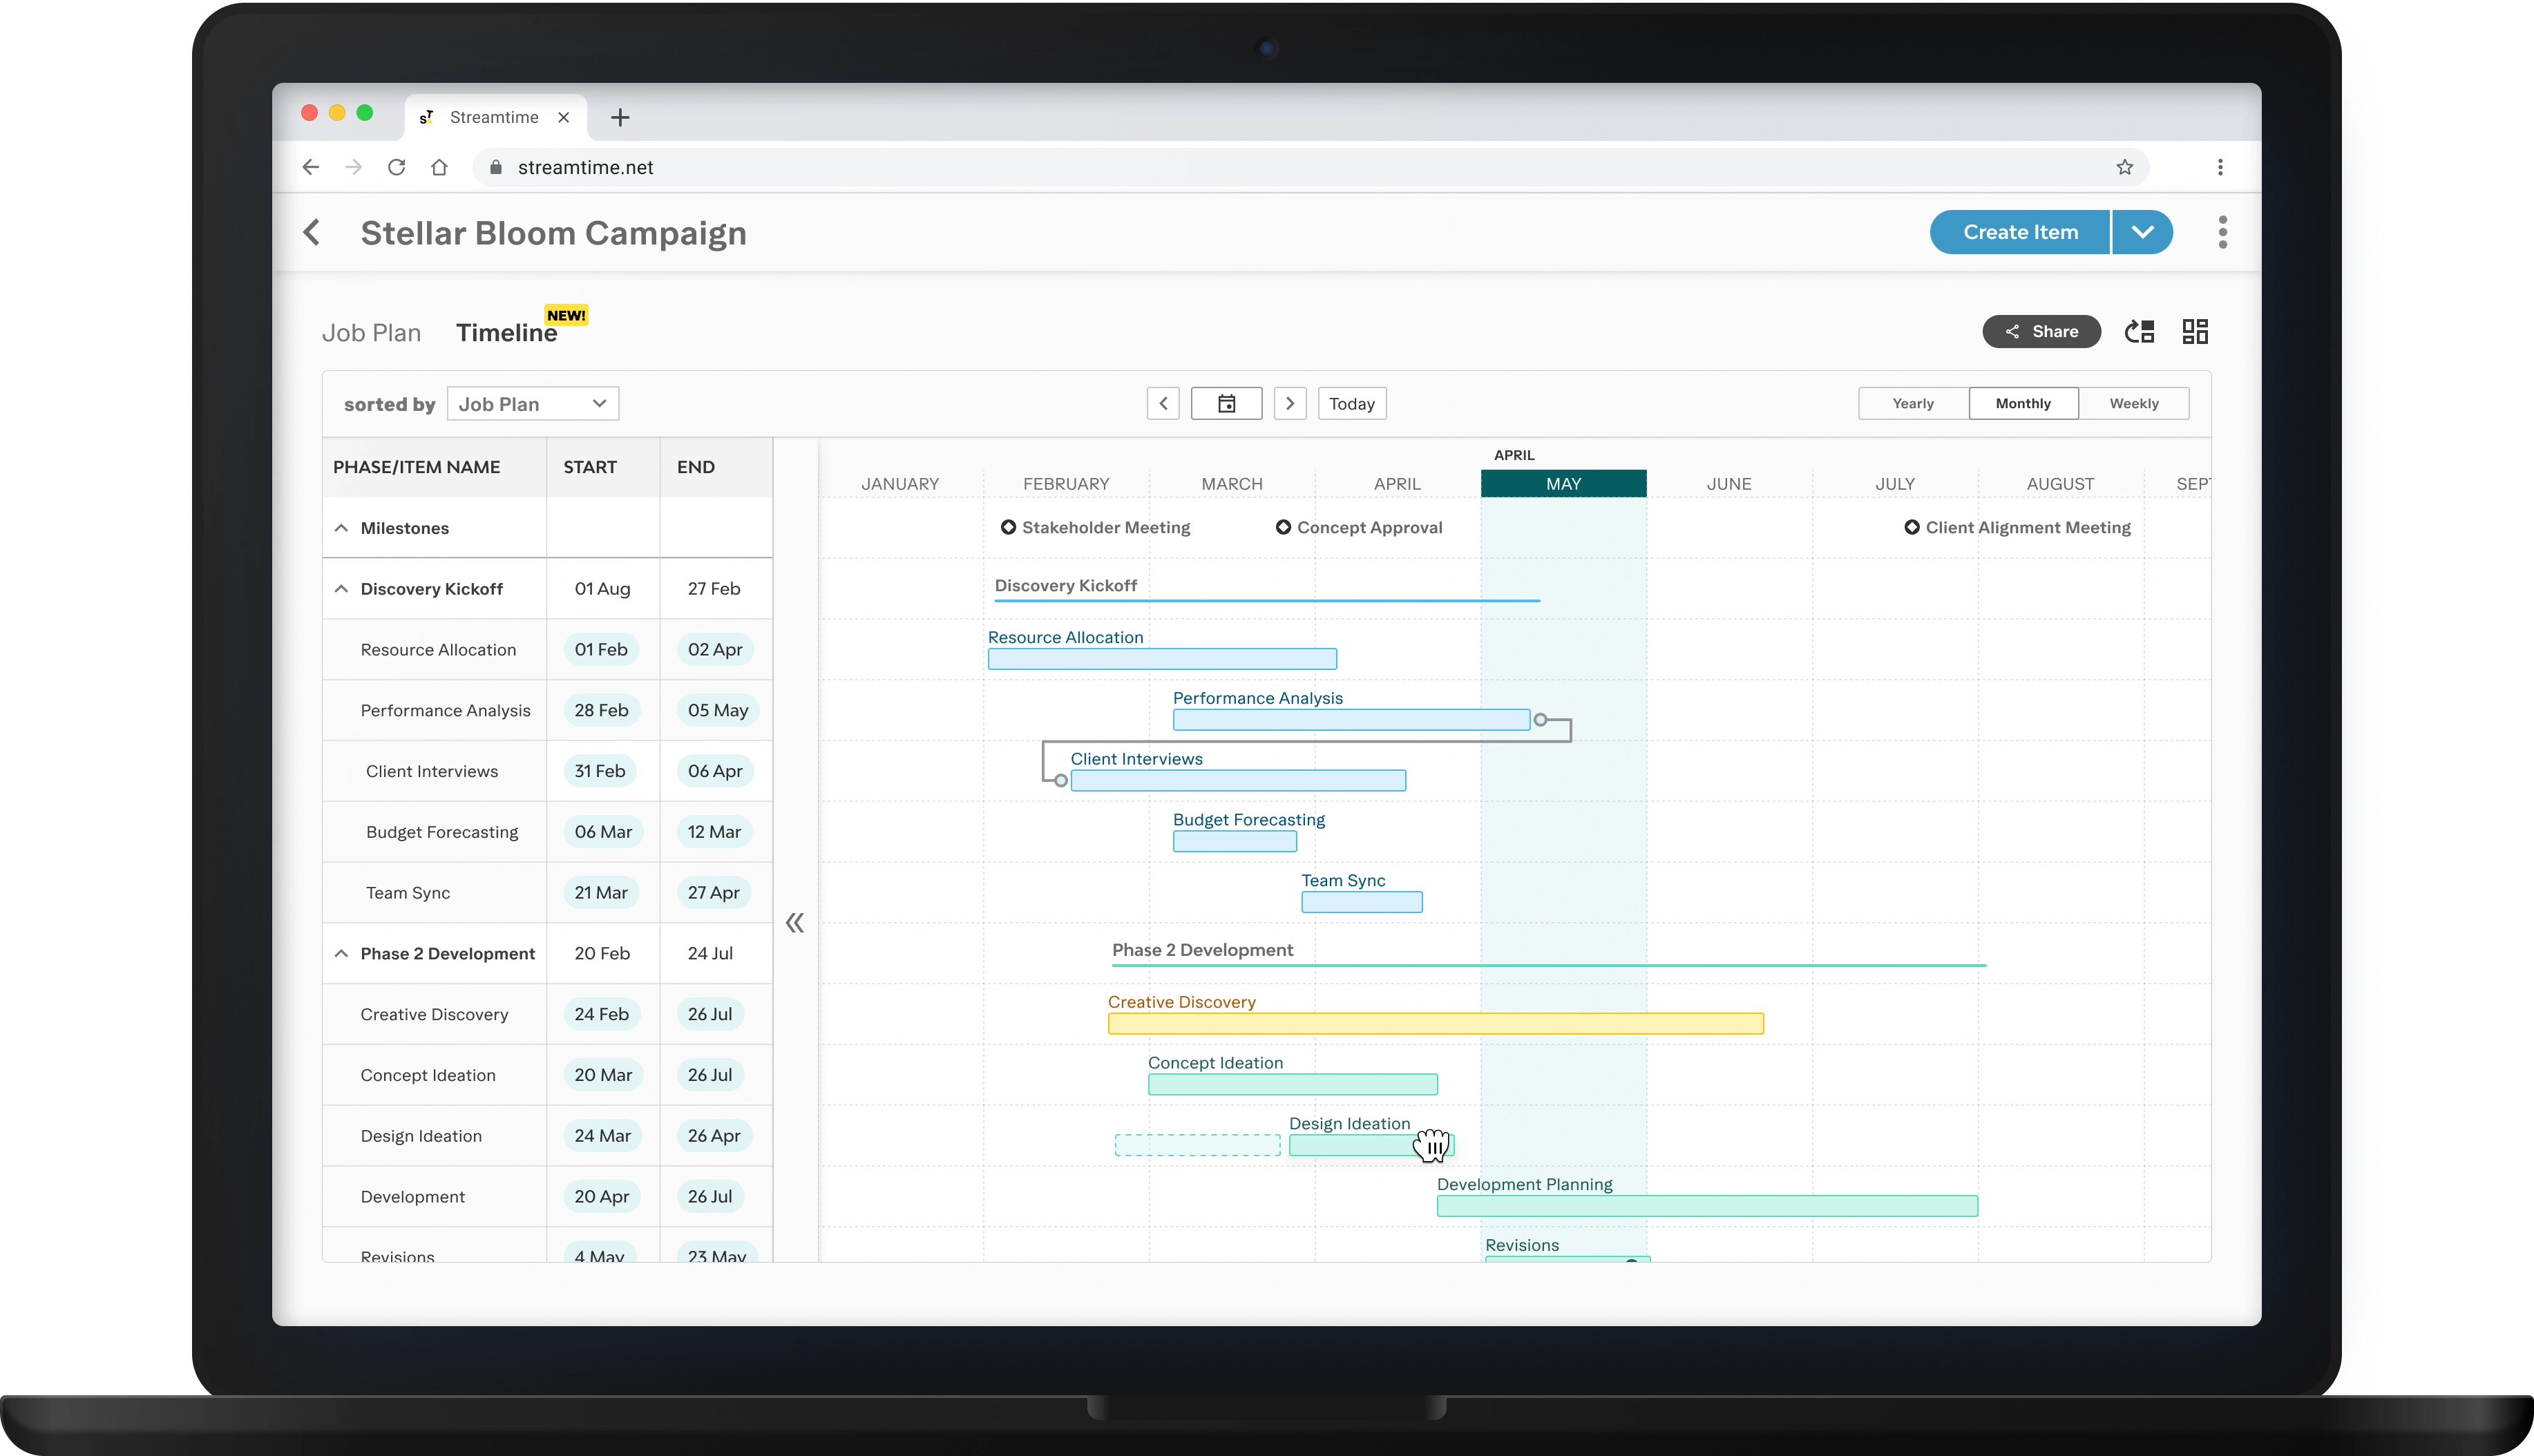
The feature quietly pushing users into spreadsheets
Since 2019, competitors had added client sharing, CSV export and linked milestones. Ours couldn’t produce anything fit to show a client.
My brief was to research it, design it, ship it, and see it through to launch.
What we heard
“The worst part of the entirety of Streamtime.”
02 Research
Digging into six years of feedback to find the real problems
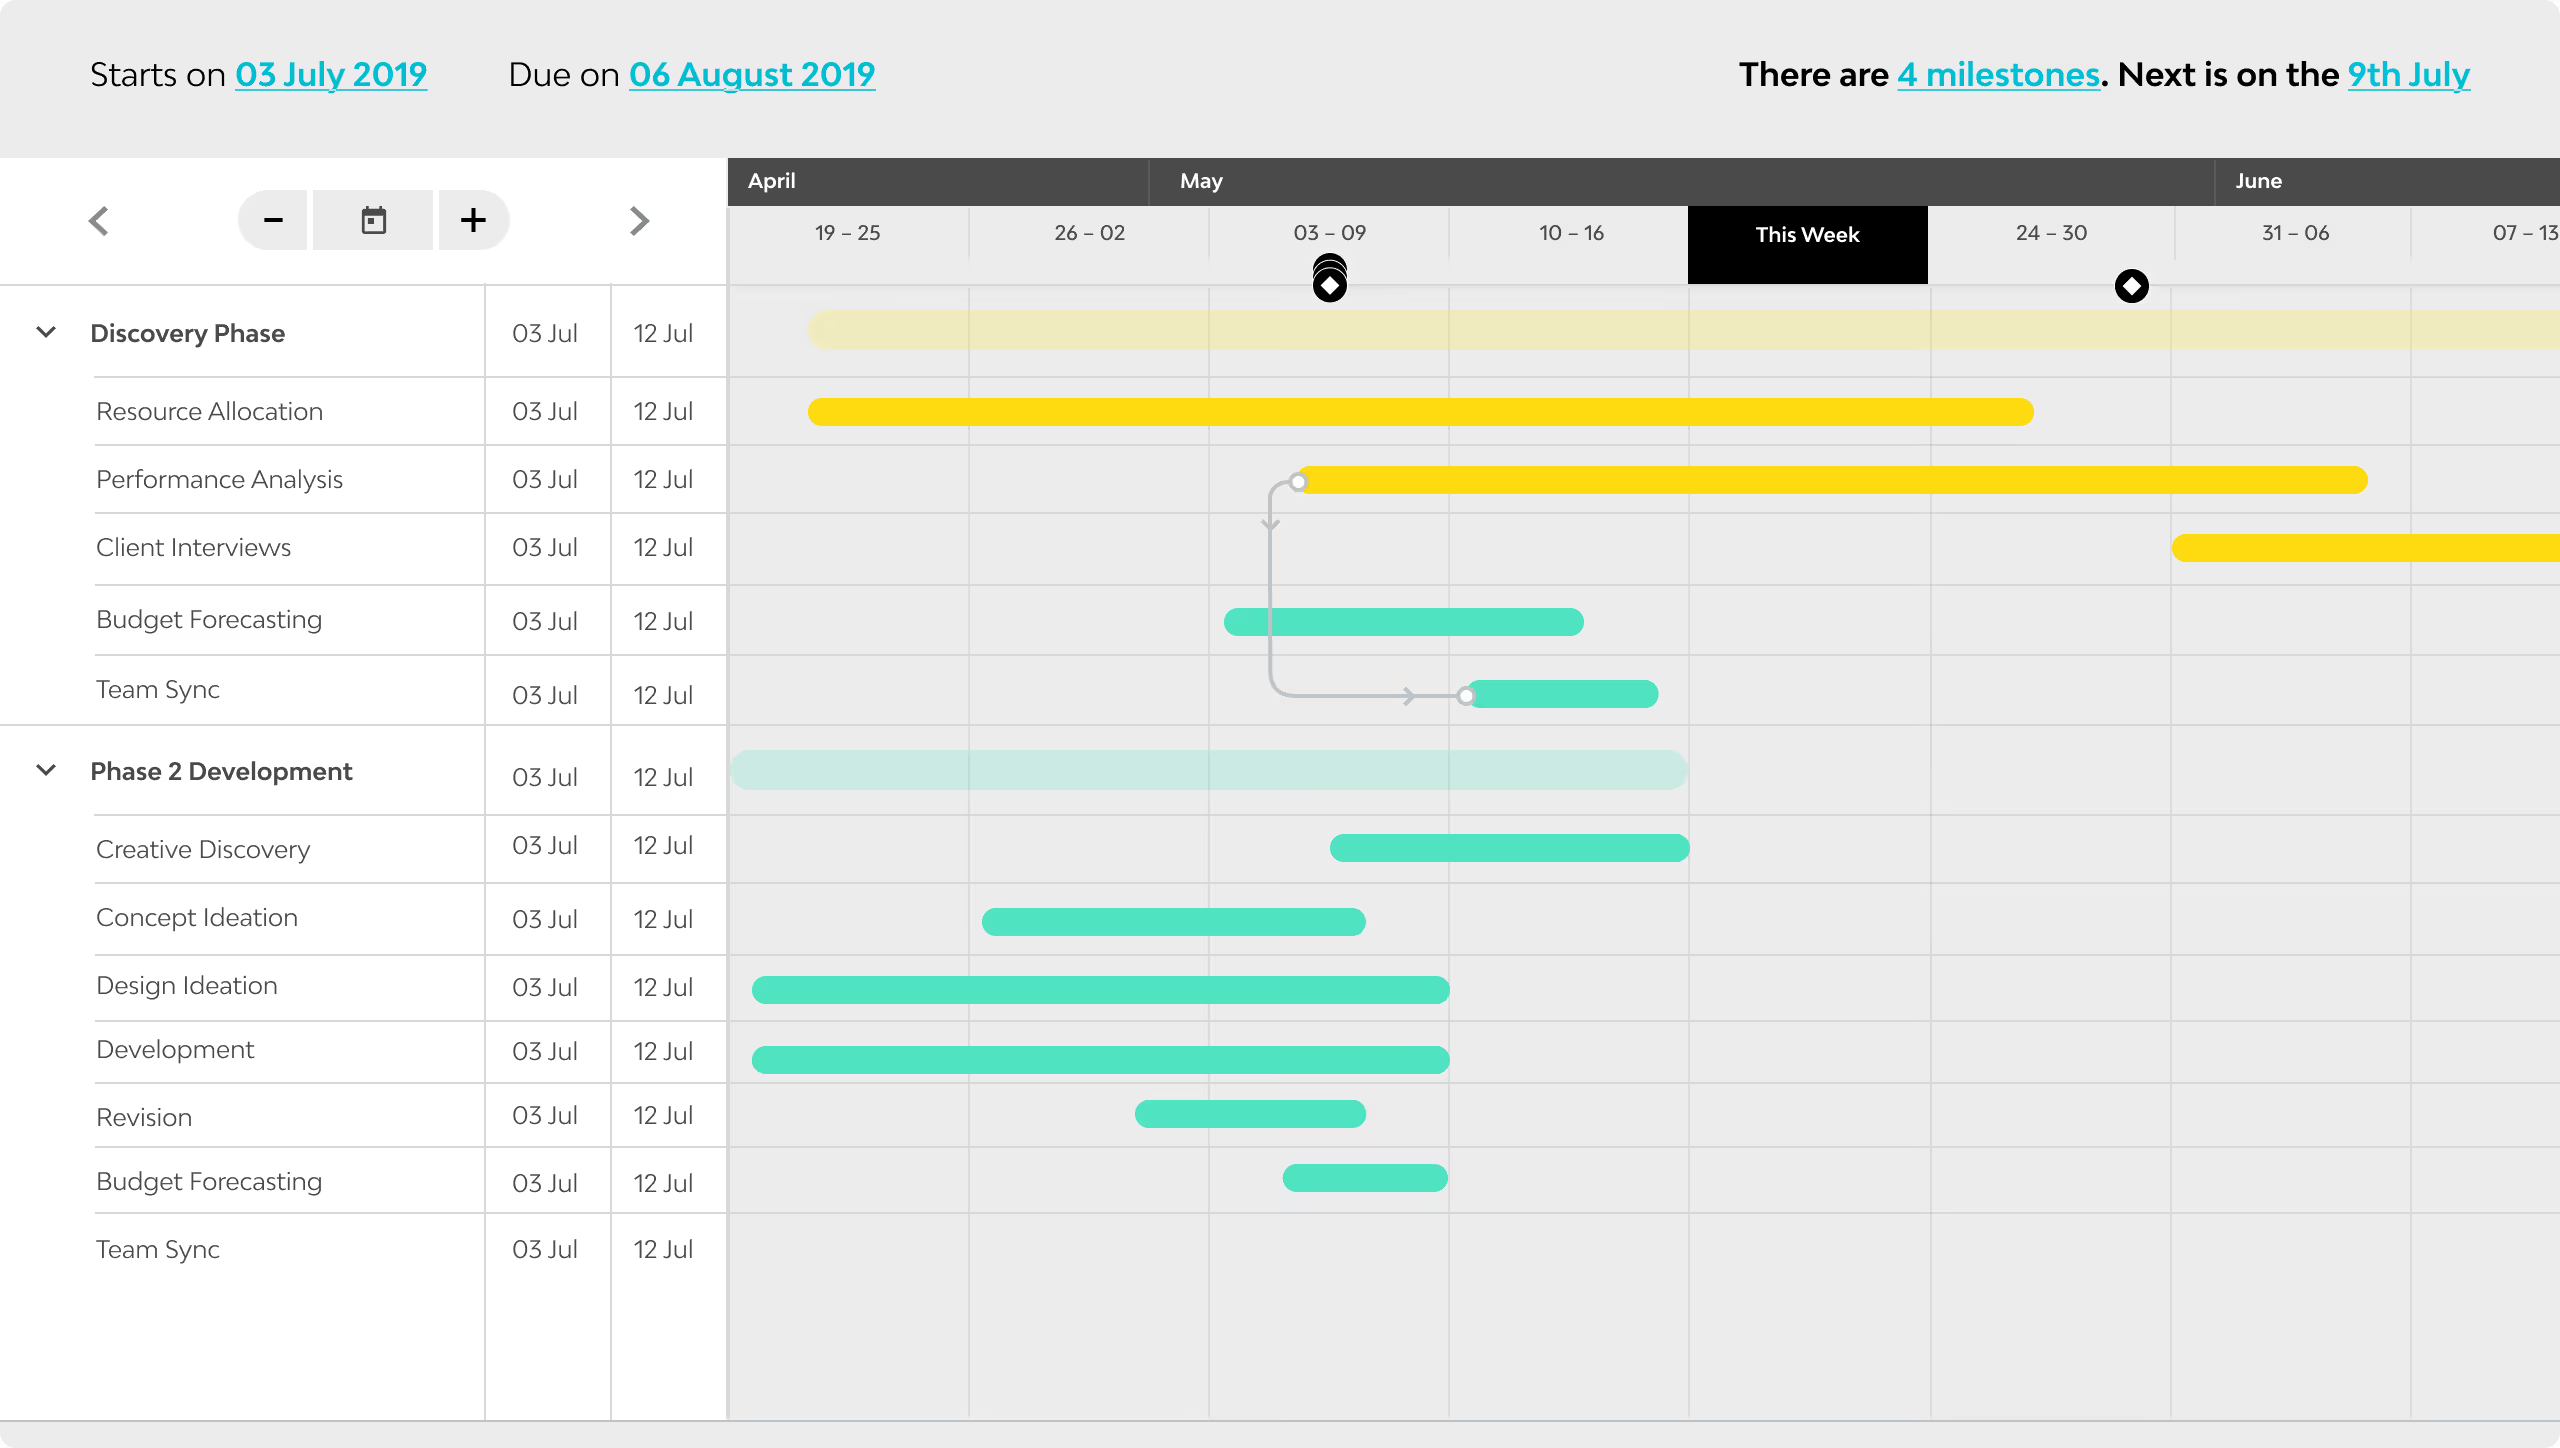
Before opening Figma, I grouped six years of support feedback into the four pain points that came up most:
- New items couldn’t be added in the Gantt chart, so users kept switching back to the job plan.
- Milestones didn’t move when their item moved.
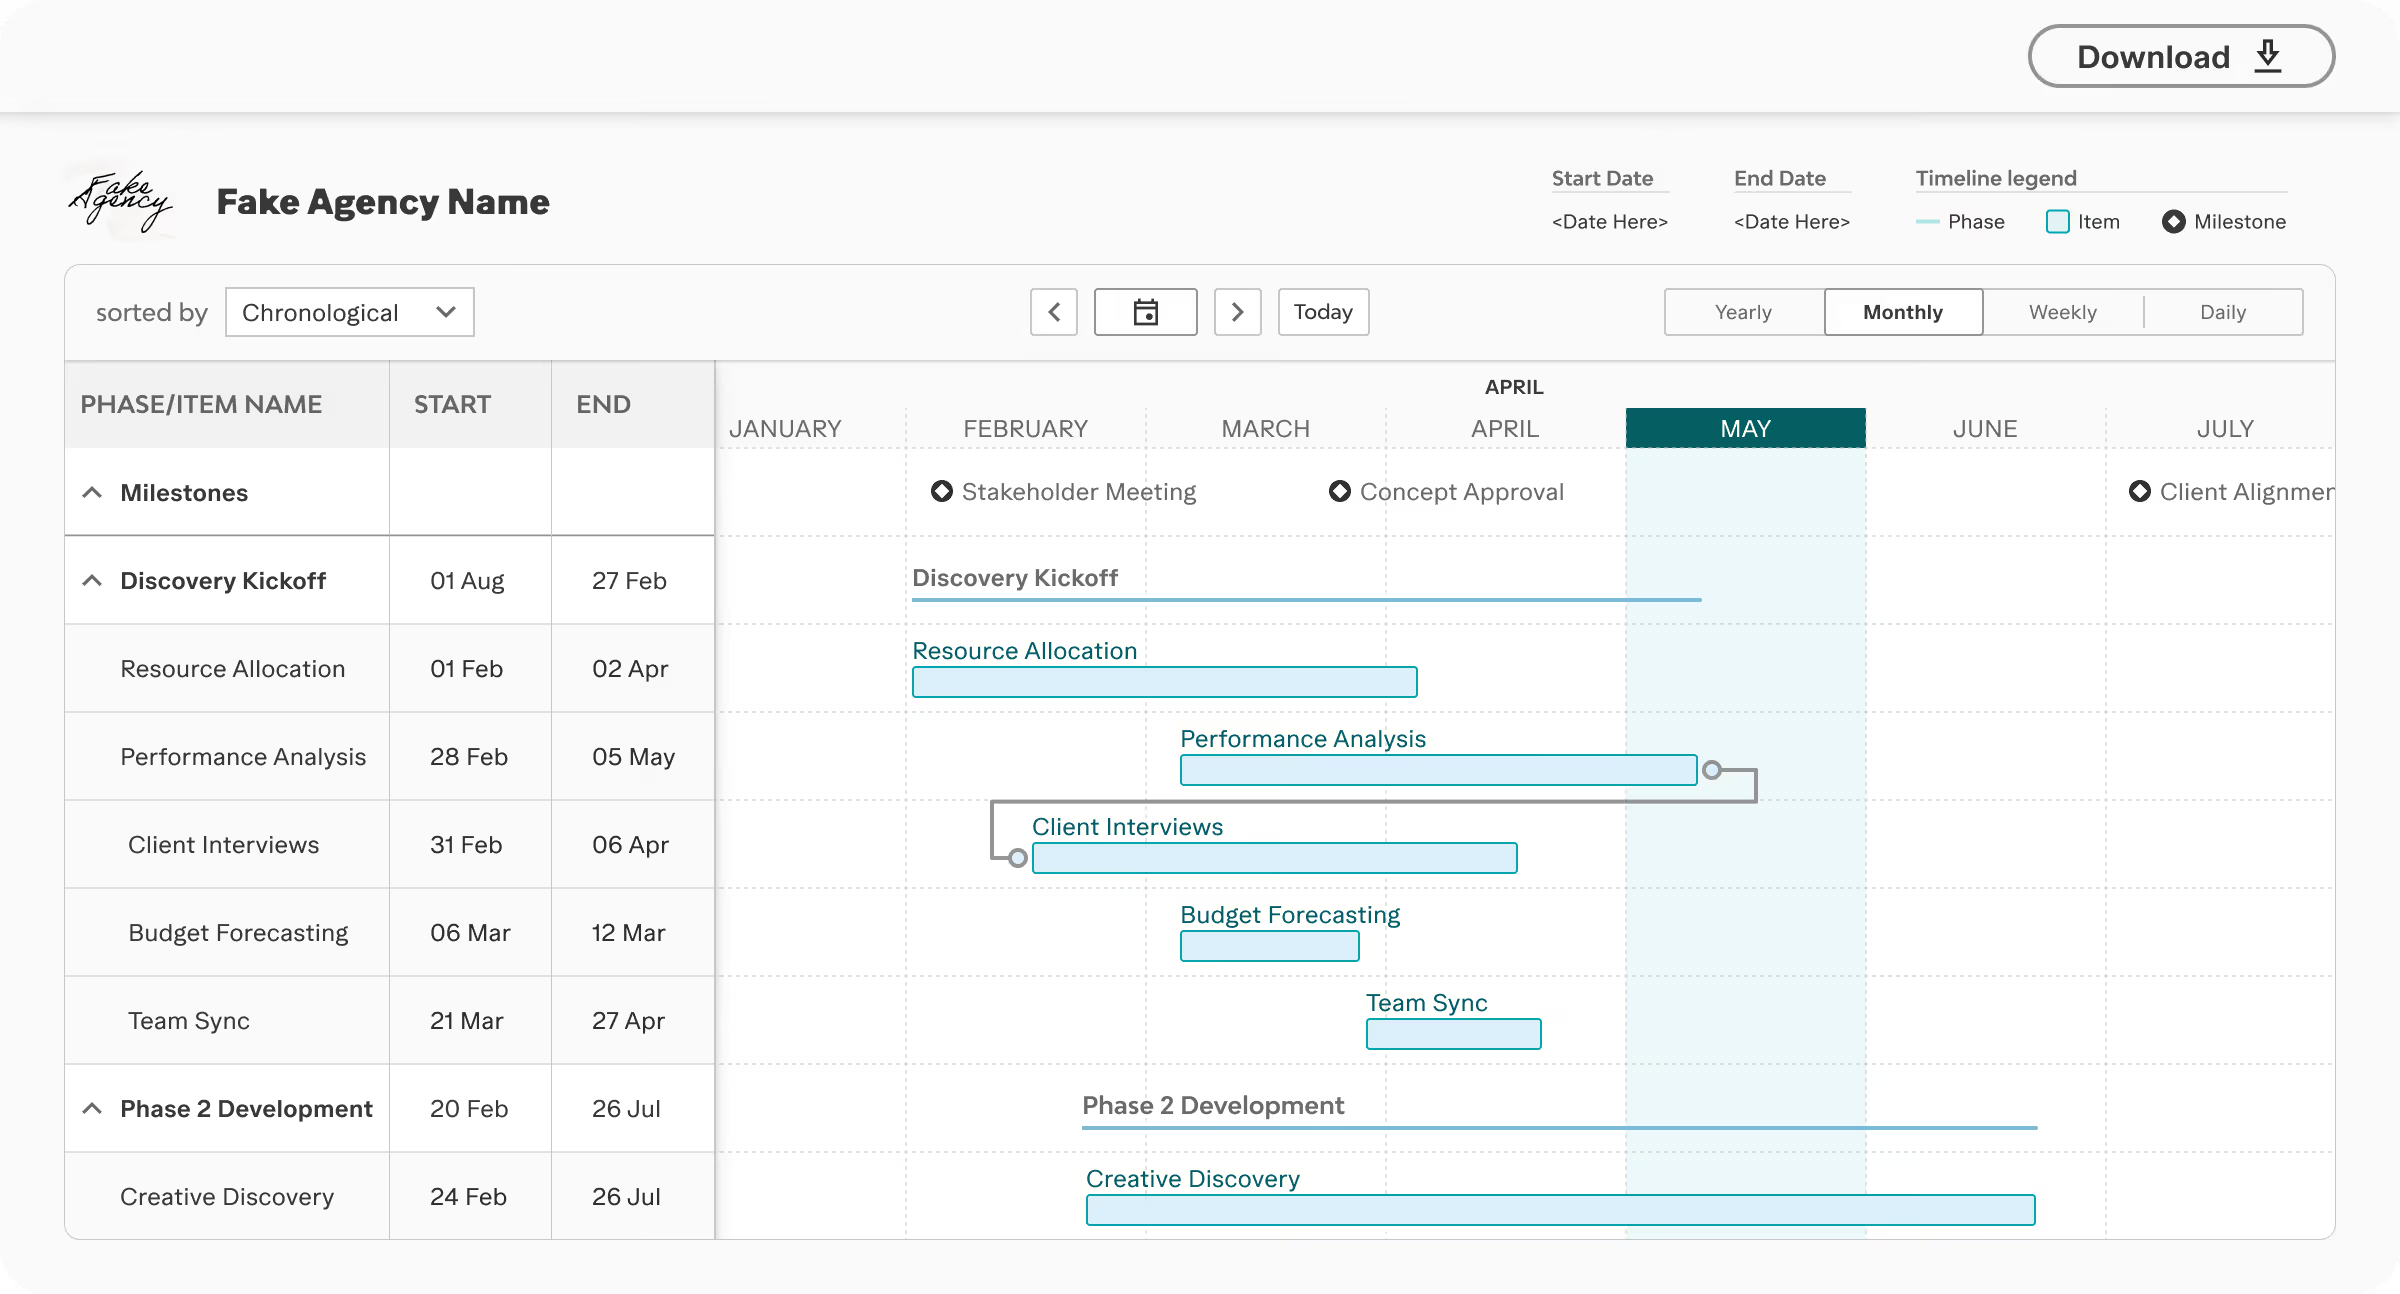
- There was no way to share a timeline with clients.
- Exports were PDF only, despite ongoing requests for CSV.
03 Design
Scoping it down, then letting studios share with clients
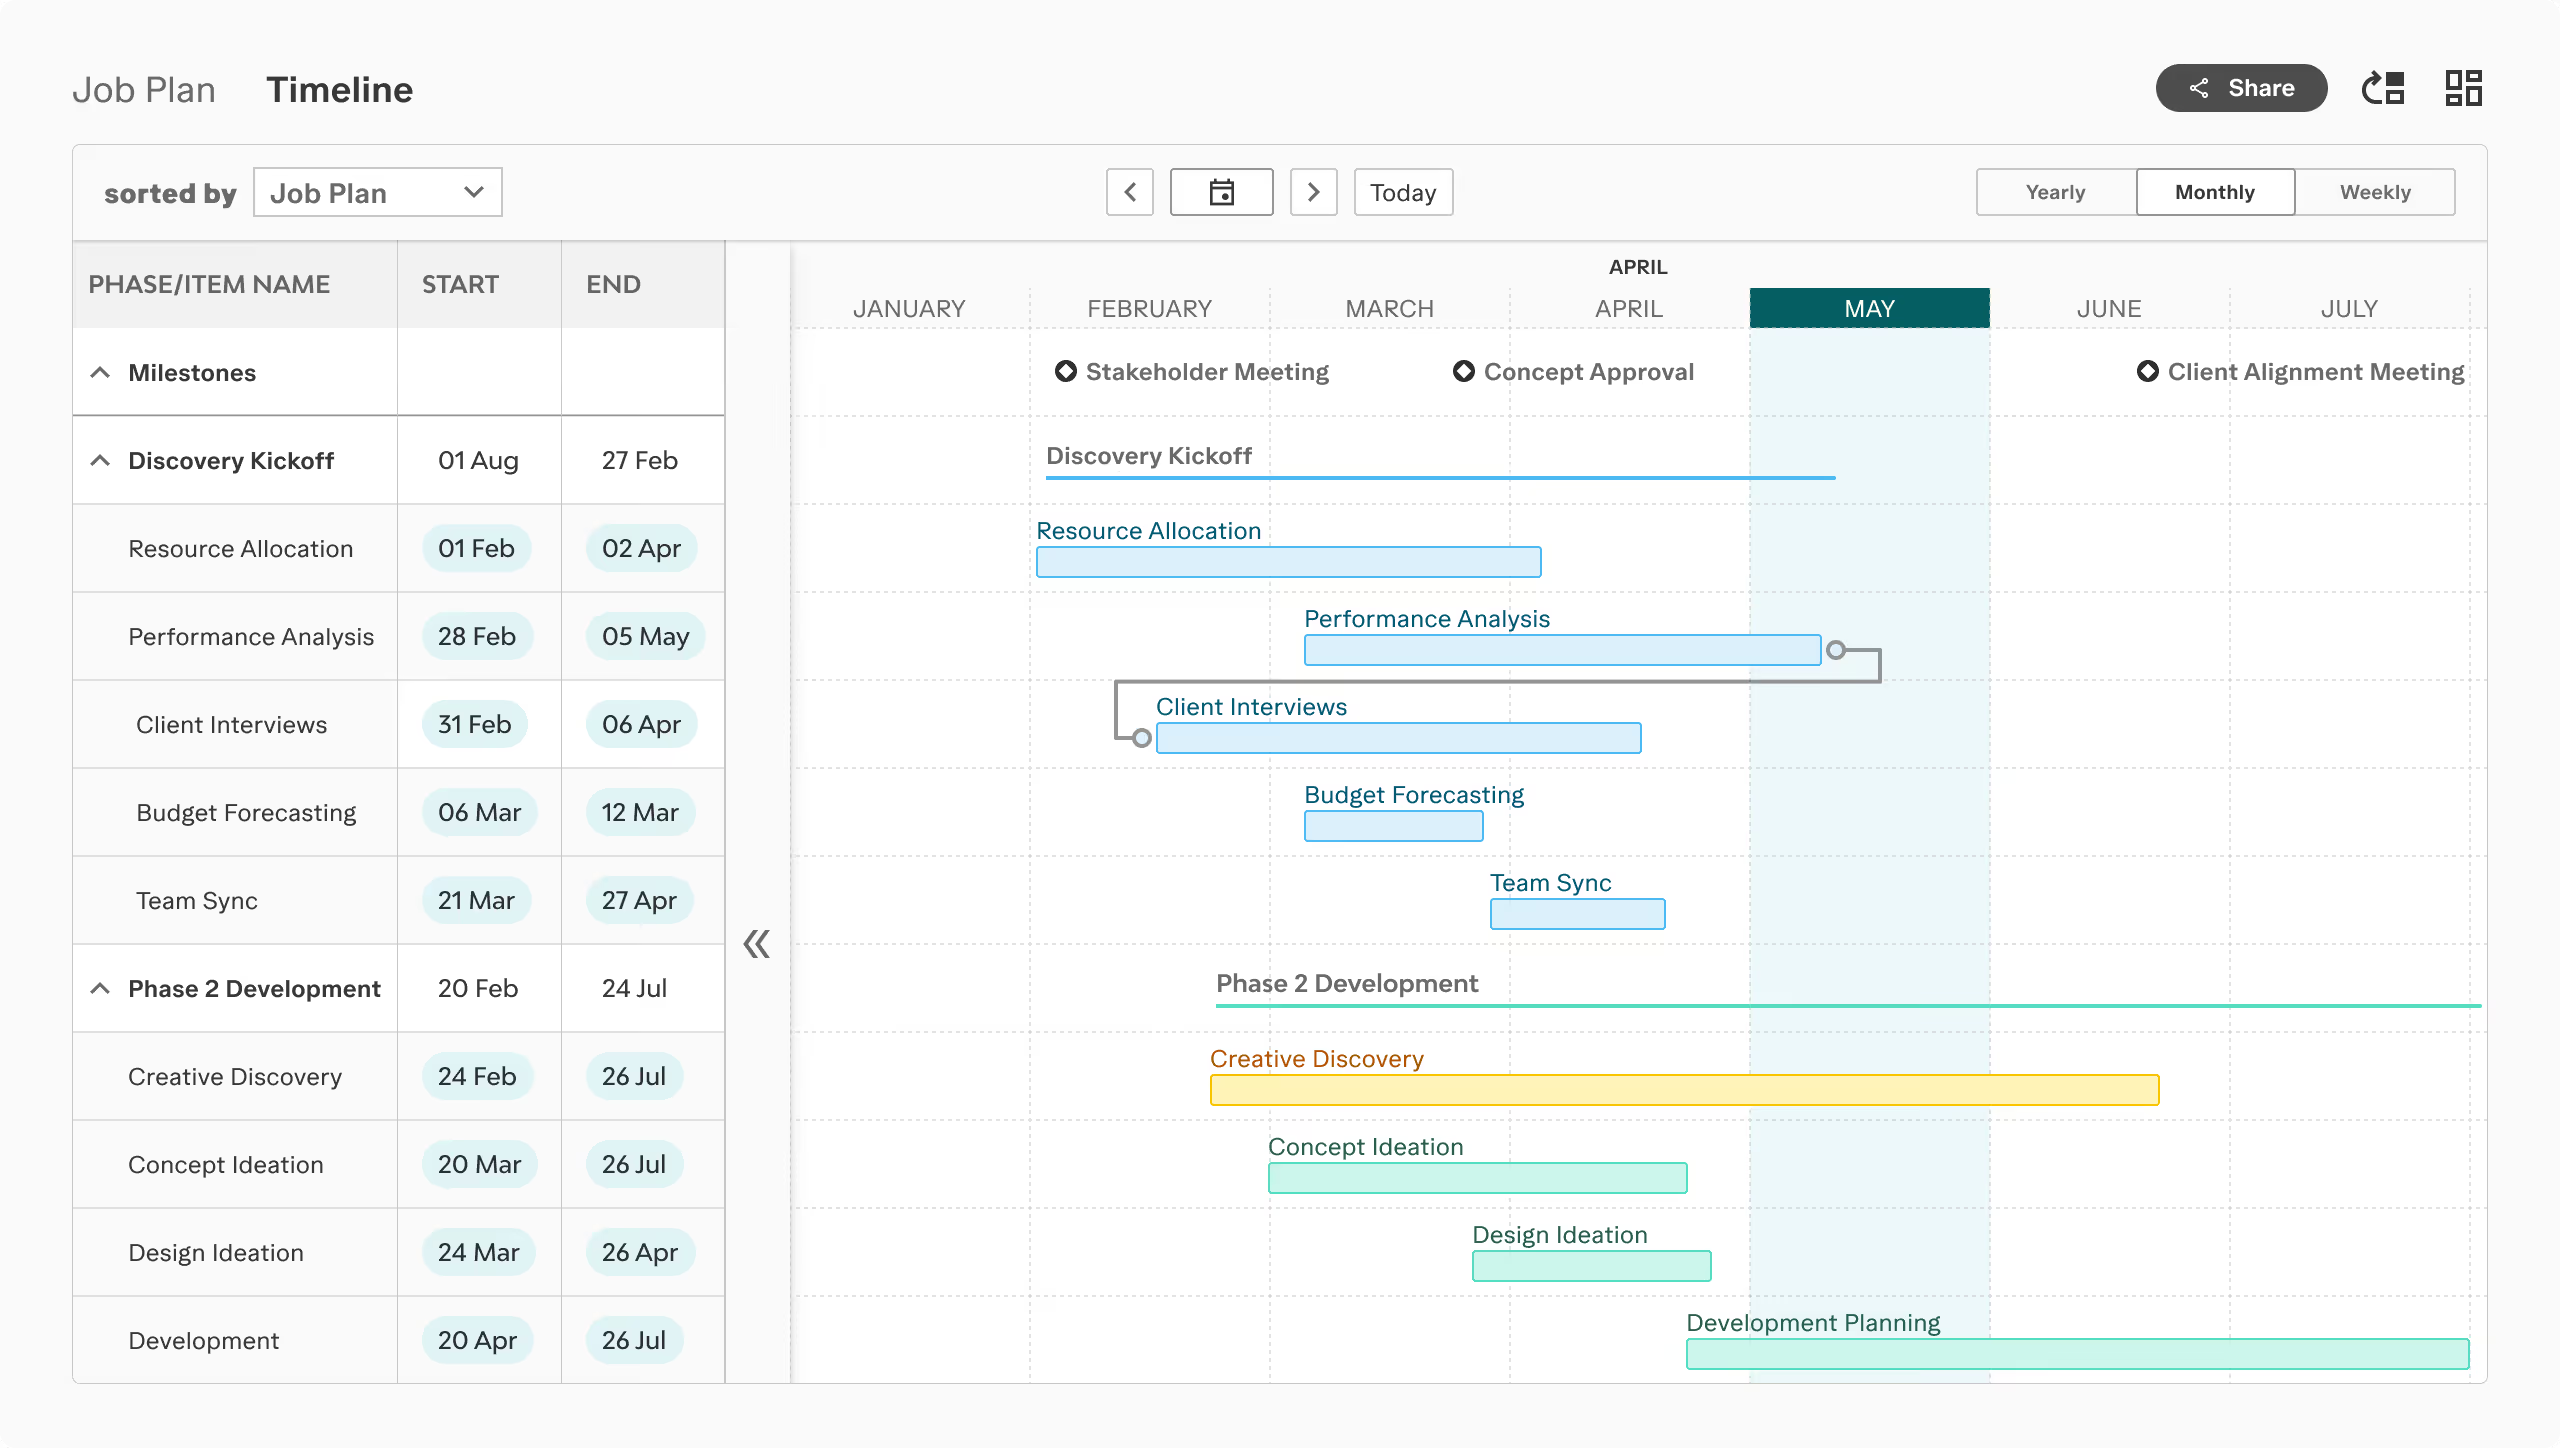
I sketched at low fidelity and tested layouts with engineering, then scoped the release to the four pain points above. All four shipped.
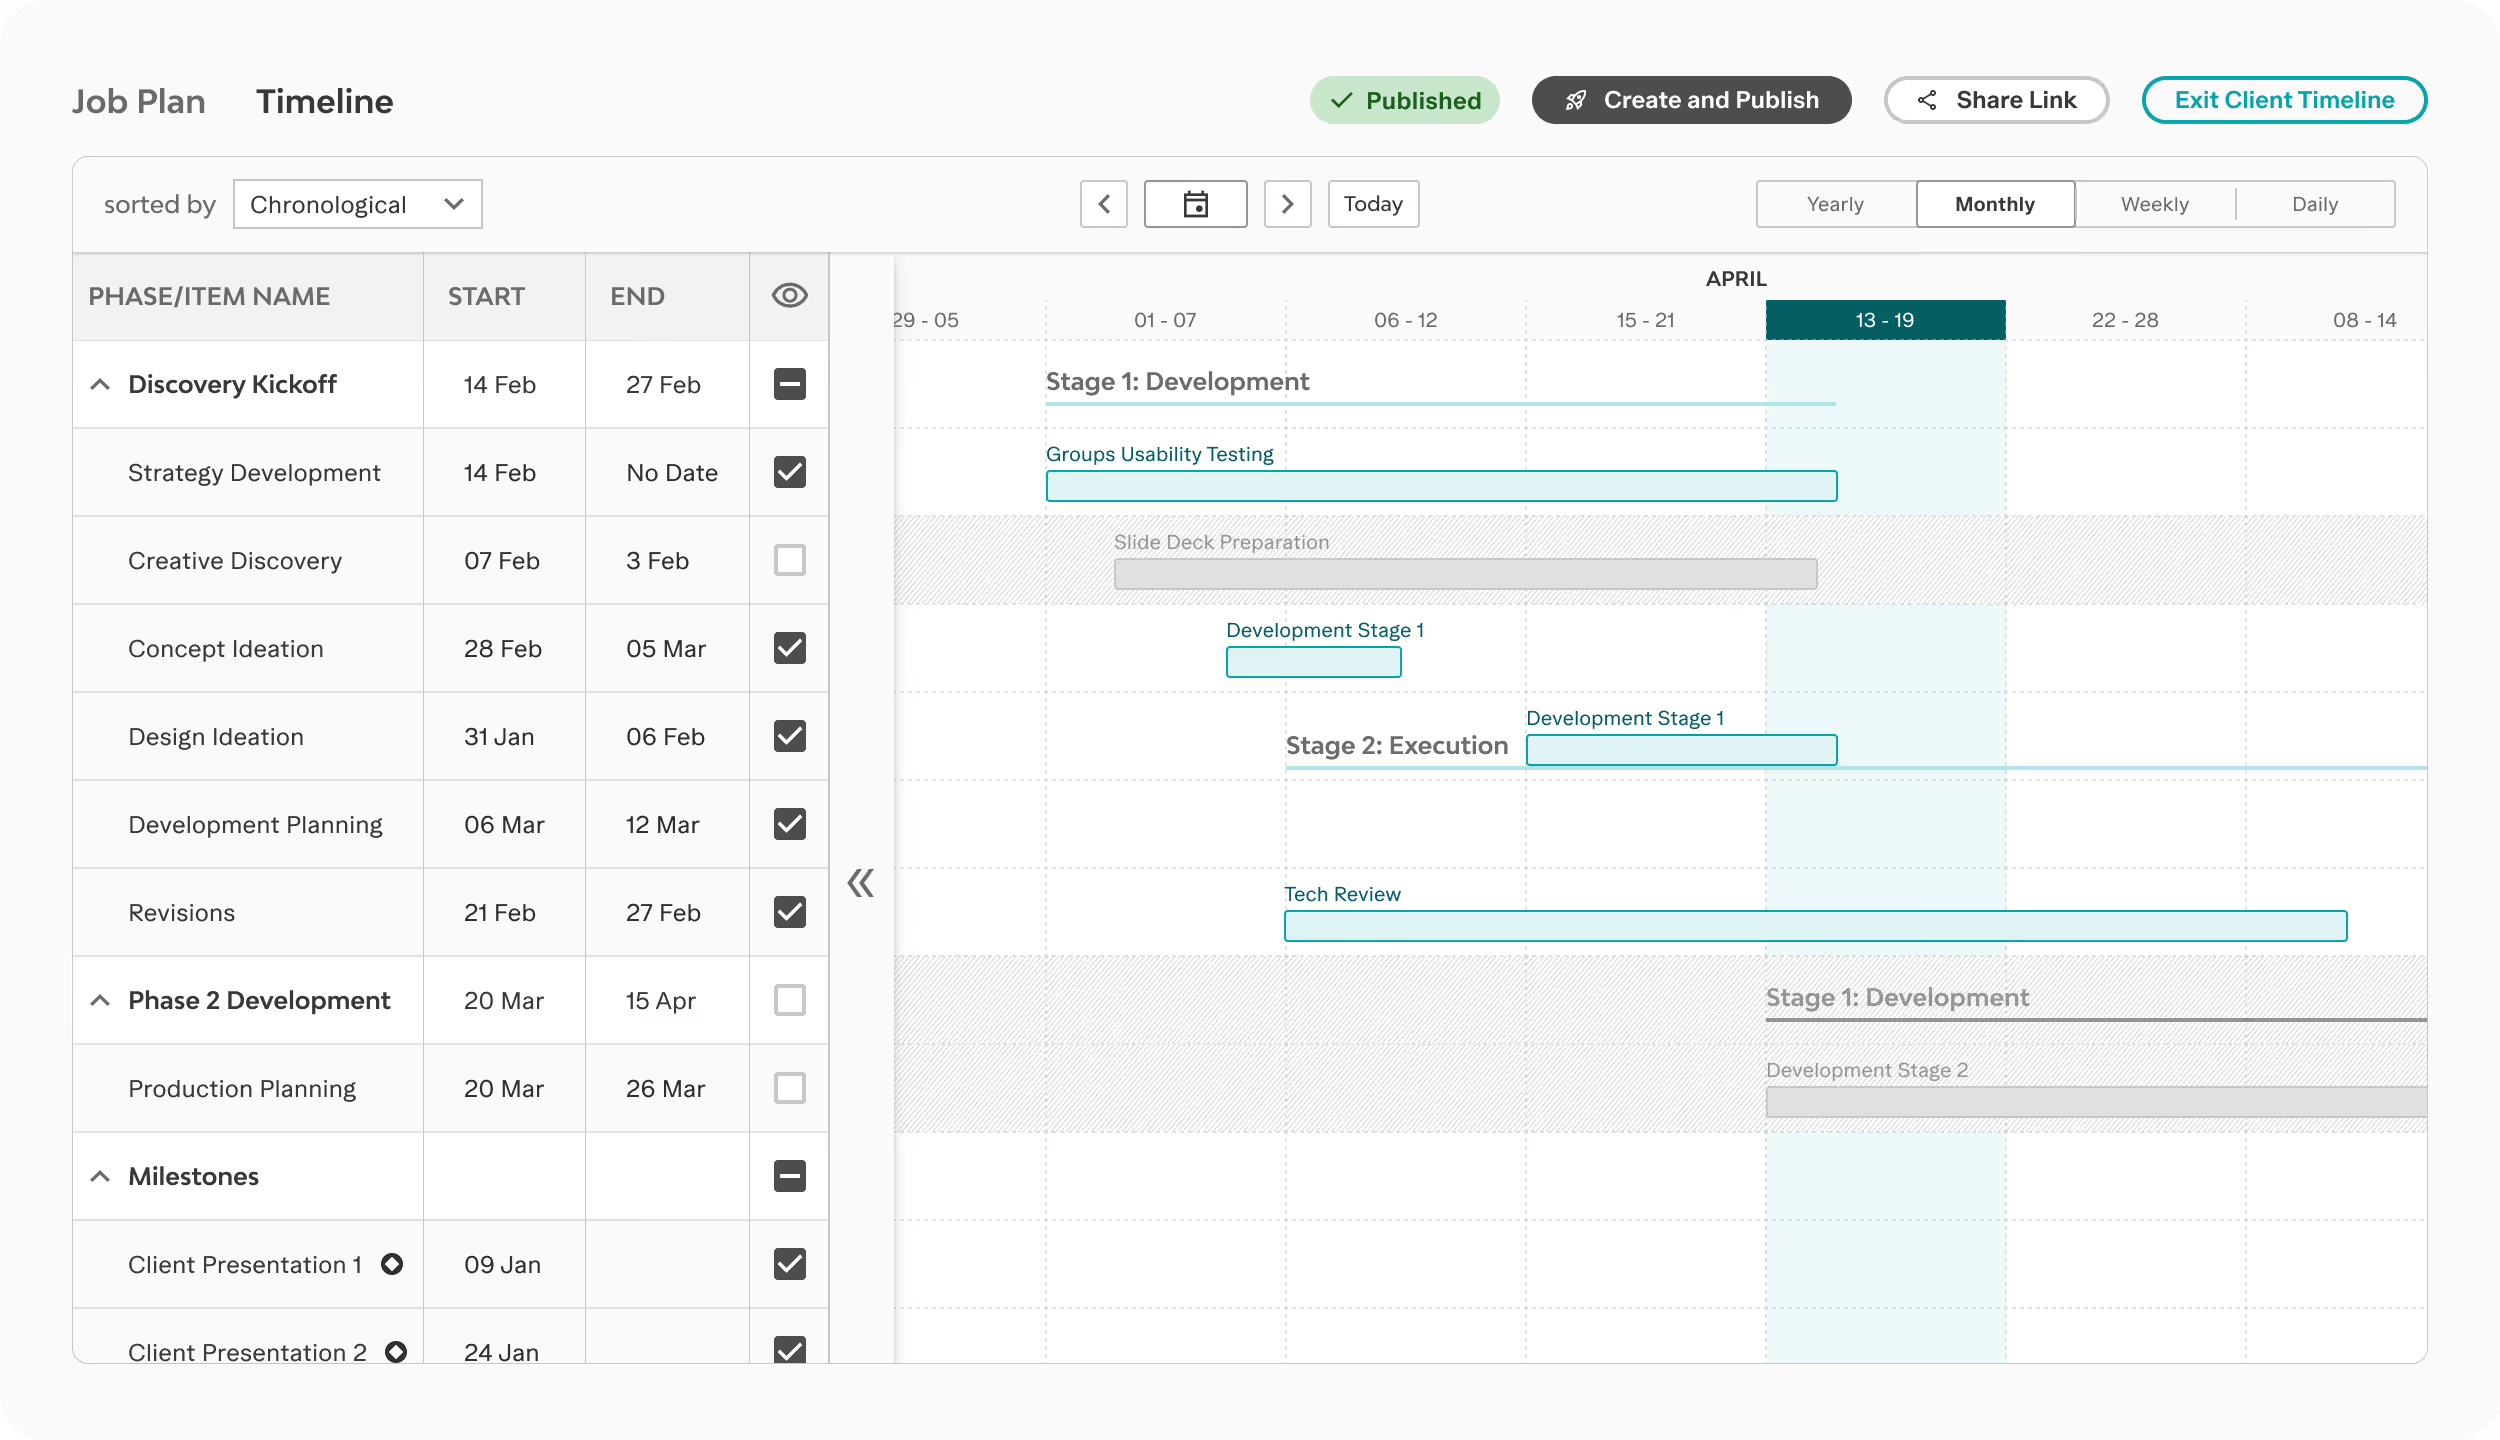
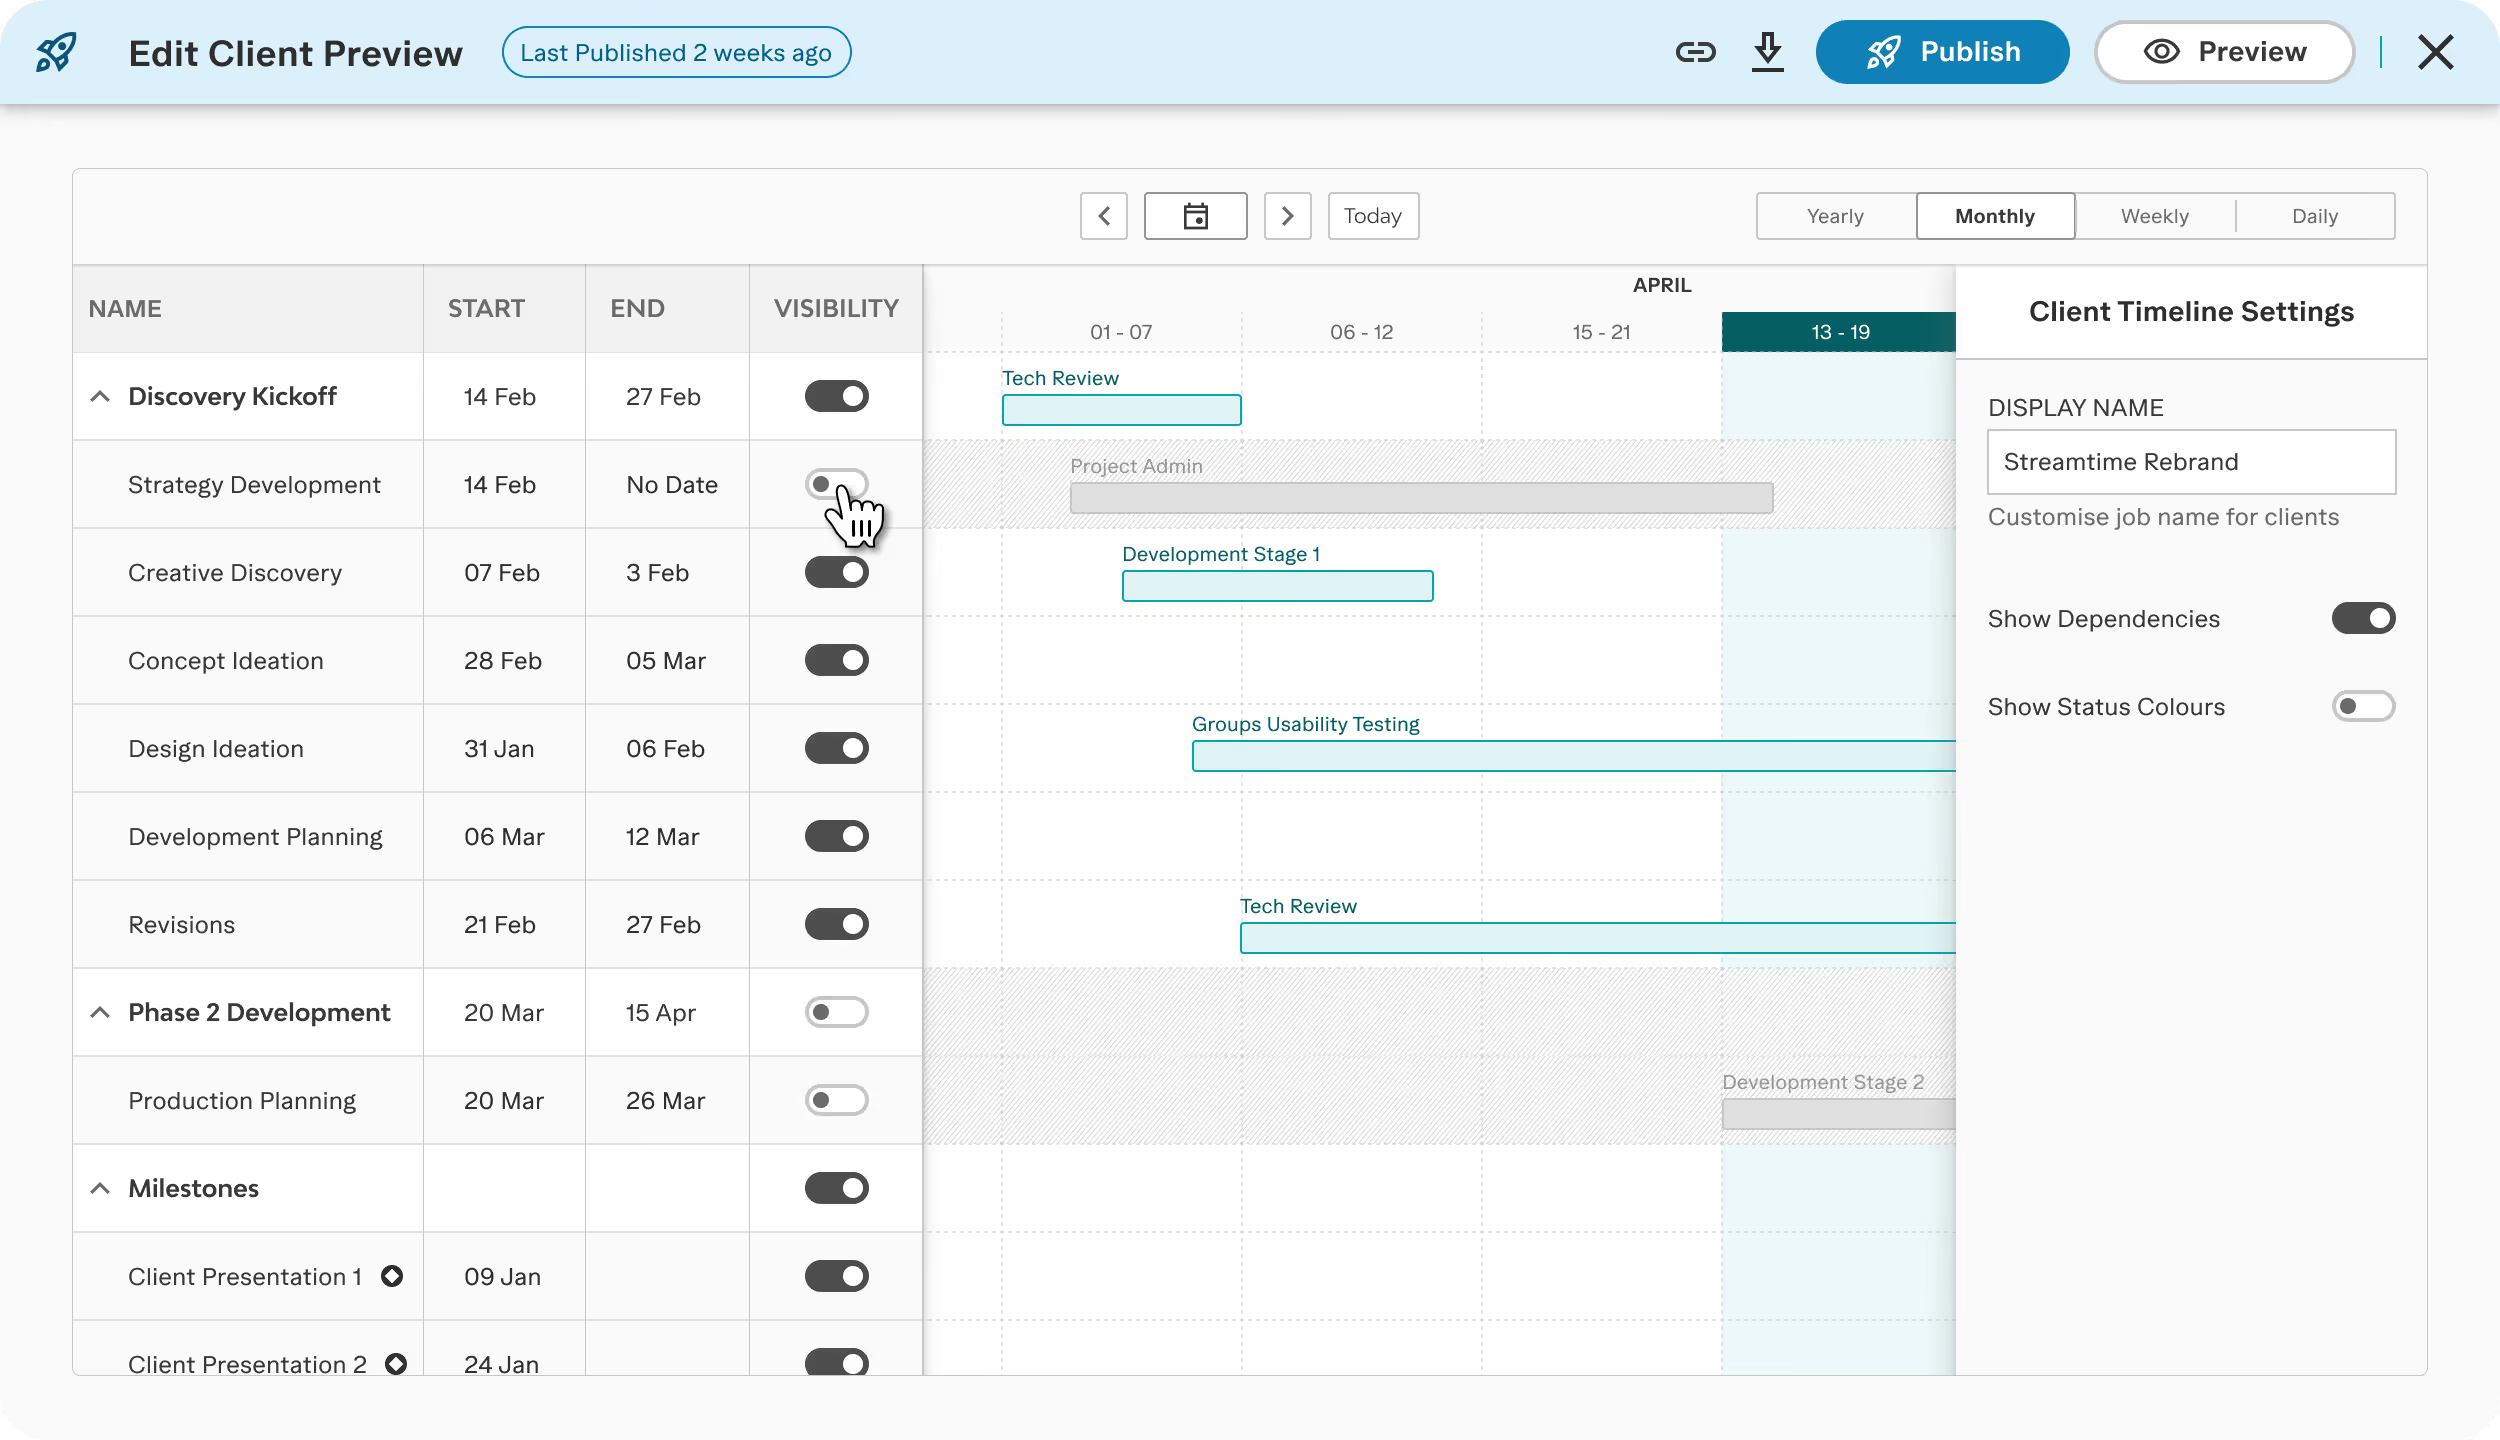
The biggest of those was sharing, so I designed a Client View. In client edit mode, studios hide what they don’t want shown, then publish a read-only timeline.
I chose publishing over live sync. A live link would send half-finished changes to clients; studios need to share only when they’re sure.
04 Testing
What users showed me I’d got wrong
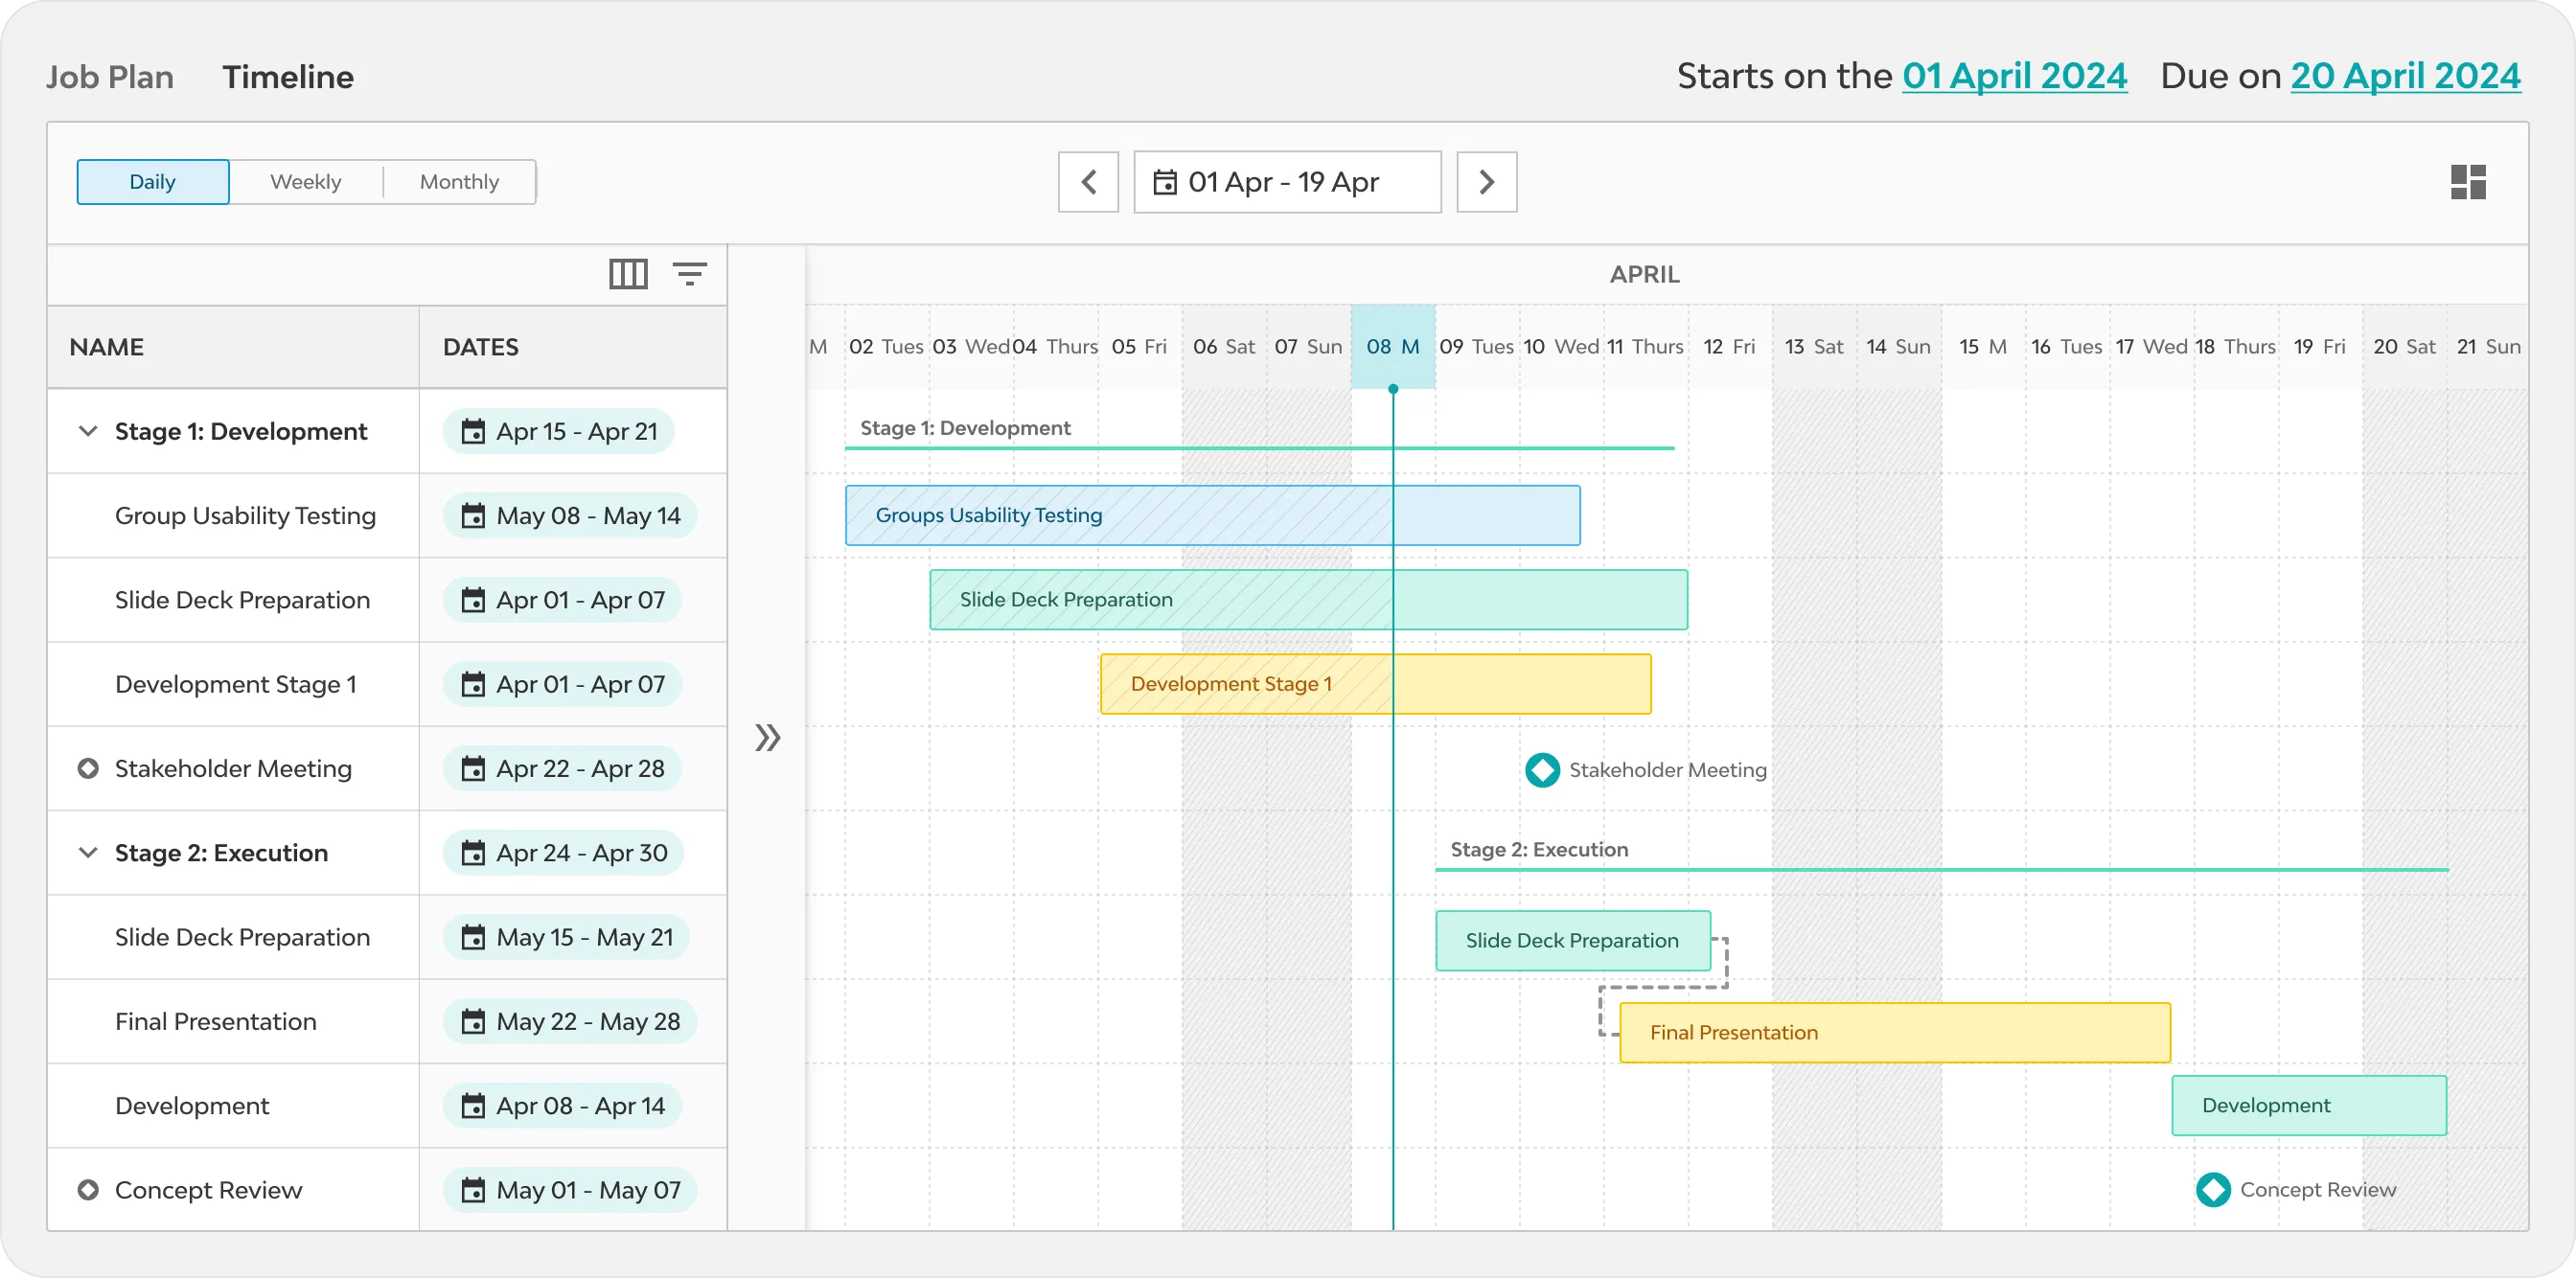
I ran six sessions with creative studios, each using their own account data. Everyone saw the value of the Client View straight away. The problems were all in how they reached it.
Participants couldn’t tell the modes apart
Several worked in client edit mode, thinking it was their main timeline.
- Gave client edit mode its own tinted header that names the mode and shows when it was last published.
- Rewrote the microcopy throughout the flow.
A publish modal appeared the moment users entered client edit mode
It arrived before they were ready, and left them disorientated.
- Removed the publish modal on entry.
Everyone previewed the Client View before returning to edit
So I couldn’t tell whether the preview flow or the visual hierarchy caused the confusion.
- Reworked both the preview flow and the visual hierarchy.
05 Outcome
What changed after launch
We launched it with a webinar, a launch video and a blog Q&A. Within a fortnight, studios were publishing client links, and one research participant moved off Google Sheets and into Timeline.
We have tried out the new timeline feature and we are obsessed! We haven’t been able to build out timelines in Streamtime in the past, but now with the updates we will be using Streamtime.
06 Reflection
What I’d do differently next time
I’d test the Client View at low fidelity, where the mode confusion would have shown up sooner. And I’d keep a written decision log, because tech-review decisions got lost in conversation.

